Polymarket Prices 42% Odds US Forces Enter Iran by March 31
The Loudest $506K in Prediction Markets
Twenty-one million dollars in volume sits behind a question that, two years ago, would have seemed hypothetical: will US military personnel physically enter Iranian territory? The market prices the March 31 deadline at 42% — a coin-flip minus a nudge — but the number that matters more is $506,000. That's the total liquidity across all timeframes. Strip the drama from the volume figure and what you find is a market where the price discovery mechanism is dangerously thin. A single motivated trader deploying $200K could reprice the entire probability curve. Whether that makes the 42% signal meaningfully informative or structurally unreliable depends on how you read the architecture beneath the headline number.
The thesis here is straightforward but uncomfortable: the market is generating substantial volume because it captures genuine geopolitical fear, but the liquidity profile means these prices are less a forecast and more a real-time sentiment thermometer with a very wide margin of error.
The Volume-Liquidity Fracture
Let's do the math that matters. The market has turned over $21.24M in total volume since it opened on January 11, 2026. In the last 24 hours alone, $3.59M changed hands — a daily turnover rate of roughly 17% of lifetime volume. That's extraordinarily active. For context, many Polymarket event markets with similar total volumes see daily turnover rates of 1-3%.
But total liquidity — the resting orders available to trade against right now — stands at just $506K. That produces a volume-to-liquidity ratio above 41:1 on a lifetime basis and roughly 7:1 in the last 24 hours alone.
| Metric | Value | Signal |
|---|---|---|
| Total Volume | $21.24M | High engagement, genuine interest |
| 24h Volume | $3.59M | Surge — something is driving fresh positioning |
| Liquidity | $506K | Thin — prices are soft, easily moved |
| Volume/Liquidity Ratio | 41.9x | Extreme churn relative to depth |
| March 31 Price | 42.0¢ | Near coin-flip but with low confidence |
| Dec 31 Price | 70.5¢ | Market sees ~71% chance before year-end |
What does this ratio tell a trader? That most participants are taking positions and walking away rather than providing ongoing liquidity. The order book is shallow. Market makers — to the extent they exist on this contract — are either not interested or actively avoiding the exposure. And that makes sense: market-making a binary geopolitical event with catastrophic tail risk and no natural hedge is a losing proposition. Nobody can delta-hedge an invasion.
The $3.59M in 24-hour volume against $506K in liquidity suggests frenzied repositioning. Traders are not gently adjusting — they're reacting to something. On March 14, that something is likely tied to the escalating diplomatic and military dynamics between the US and Iran that have dominated headlines in early 2026.
Dissecting the Probability Curve
The market structure tells a story through what has already expired and what remains live.
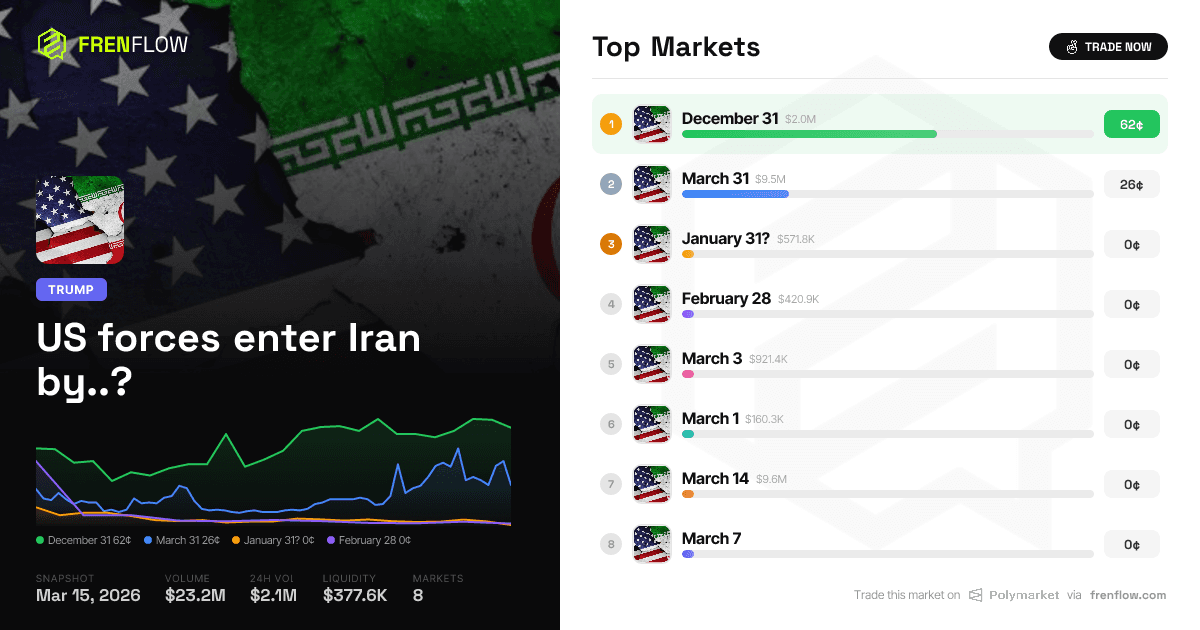
The January 31, February 28, March 1, March 3, and March 7 contracts all resolved to No and now trade at 0¢. The March 14 contract — today's date — sits at 2.1¢ with a staggering $8.58M in volume. That volume figure deserves scrutiny. Nearly $8.6M was wagered on whether US forces would enter Iran by today. As of writing, it hasn't happened, and the contract is hours from settling at zero.
| Deadline | Price | Volume | Status |
|---|---|---|---|
| Jan 31 | 0.0¢ | $572K | Expired No |
| Feb 28 | 0.0¢ | $421K | Expired No |
| Mar 1 | 0.0¢ | $160K | Expired No |
| Mar 3 | 0.0¢ | $921K | Expired No |
| Mar 7 | 0.0¢ | $0 | Expired No |
| Mar 14 | 2.1¢ | $8.58M | Expiring today |
| Mar 31 | 42.0¢ | $8.70M | Live |
| Dec 31 | 70.5¢ | $1.88M | Live |
The March 14 contract's $8.58M in volume is almost identical to the March 31 contract's $8.70M. But the March 14 contract is about to expire worthless. Here's the implication: a massive amount of capital cycled through the near-term contract — likely traders buying No at very low prices to harvest small but near-certain returns, alongside speculators buying Yes on geopolitical news spikes and then liquidating. The volume reflects activity, not conviction about a March 14 invasion.
The March 31 contract is the current battleground. At 42¢, a $1,000 Yes position returns $2,380 if US forces enter Iran within 17 days — a 138% return in under three weeks. A No position at 58¢ returns $1,724, or a 72% return. Those are enormous risk premiums, and they reflect genuine uncertainty rather than a market leaning confidently in either direction.
The December 31 contract at 70.5¢ is more revealing. The market assigns a roughly 71% probability that US forces enter Iran at some point in 2026. That's a striking number. It implies that even if March passes without an incursion, traders see the rest of the calendar year as carrying substantial cumulative risk.
The gap between March 31 (42%) and December 31 (70.5%) implies the market assigns roughly 28.5 percentage points of additional probability to the April-December window. In other words, if March 31 resolves No, the market would expect the December contract to still trade around 49¢ — essentially a coin flip for the remaining nine months. That's a useful number to have in your head if you're thinking about where value sits after March expiration.
What $3.59M in Daily Volume Is Responding To
I won't speculate about classified intelligence or unpublished diplomatic cables. But I can map the catalyst structure.
The market opened January 11, 2026, which strongly suggests it was created in response to specific geopolitical developments involving US-Iran tensions at that time. The rapid accumulation of $21M in volume in roughly two months signals this isn't a niche curiosity — it's tracking something traders view as a live, material scenario.
The $3.59M surge in 24-hour volume on March 14 — the day the March 14 contract expires — could reflect several dynamics simultaneously:
- Final settlement activity: Traders closing March 14 No positions to free up capital for March 31.
- Rollover: Capital migrating from the expiring near-term contract into the March 31 contract, which would explain why March 31 has accumulated $8.70M.
- News-driven repositioning: If any credible reporting emerged in the last 24-48 hours suggesting escalation, the thin order book would amplify price moves.
The 42% price on March 31 is the critical signal. Seventeen days is a short window. For context, even during the most tense periods of US-Iran relations in recent decades, the gap between saber-rattling and boots on the ground has typically been measured in months, not weeks. The market pricing 42% for a 17-day window implies traders see either an active military operation already in some stage of planning or execution, or they're pricing the possibility of a rapid escalation from a triggering event (such as an incident in the Strait of Hormuz, a strike on a US base in the region, or a collapse in nuclear negotiations).
How to Read a Market This Thin
Here's the honest analytical caveat: a market with $506K in liquidity is not a poll of experts. It's a poll of whoever happens to be sitting in the order book at this moment.
On FrenFlow's event page, you can track how these prices move in real time, and the velocity of those moves tells you as much as the levels. A 42% price that hasn't budged in a week means something different from 42% that was 30% yesterday and 55% the day before. In thin markets, price stability is a stronger signal than the price itself.
For traders considering a position, the risk-reward arithmetic is asymmetric in both directions:
- Buying March 31 Yes at 42¢: You're paying $420 per contract for a $1,000 payout. You need to believe the true probability exceeds 42% to have positive expected value. The annualized return if correct is astronomical — but the probability of total loss is 58%.
- Buying March 31 No at 58¢: You're paying $580 for a $1,000 payout, a 72% return in 17 days. You need to believe the true probability of incursion is below 58%. Most baseline geopolitical models would place the probability of a specific military action in a 17-day window well below 58%, even in a heightened-tension environment — which suggests the No side may carry a risk premium worth harvesting.
- Buying December 31 Yes at 70.5¢: A more patient bet. $705 for a $1,000 payout, giving you nine months of exposure. The 29.5% return over approximately 290 days annualizes to roughly 37%. You need to believe the probability exceeds 70.5%.
The structural issue for all of these positions is slippage. With $506K in total liquidity, a $50K order will move the market. Entering or exiting a six-figure position without dramatically impacting your own fill price is nearly impossible. Size accordingly.
What the Market Is — and Isn't — Telling Us
Prediction markets are not intelligence agencies. They aggregate the views of whoever chooses to participate, weighted by how much capital they're willing to risk. In a market this thin, the price could reflect the conviction of a dozen whales more than broad consensus.
But the directional signal is hard to dismiss entirely. $21 million in total volume represents real money cycling through real risk. The 42% March 31 price and 70.5% December price are not numbers that emerge from casual speculation — they reflect, at minimum, a substantial cohort of traders who view a US military incursion into Iran as a realistic 2026 scenario.
The honest conclusion: the market is pricing a world where US-Iran military confrontation is more likely than not within 2026, and roughly a coin flip within the next 17 days. Whether that reflects superior information aggregation or a speculative bubble inflated by geopolitical anxiety in a thin order book is the question every participant — and observer — must answer for themselves.
The liquidity profile says: treat these prices as directional indicators, not precision instruments. The volume profile says: a lot of people are paying attention. Both of those facts matter.
Frequently Asked Questions
What are the current odds of US forces entering Iran on Polymarket?
As of March 14, 2026, Polymarket prices a 42% probability that US military personnel physically enter Iranian territory by March 31, 2026, and a 70.5% probability by December 31, 2026. These figures reflect $21.24M in total market volume but only $506K in resting liquidity.
How does the Polymarket Iran market define "US forces entering Iran"?
The market requires active US military personnel to physically enter Iran's terrestrial (land) territory. Maritime or aerial entry does not count. Intelligence operatives, military contractors, advisors, and personnel entering for diplomatic purposes are excluded. Resolution is based on a consensus of credible reporting.
How much money has been bet on US forces entering Iran?
Total volume across all timeframes has reached $21.24M, with $3.59M traded in the 24 hours ending March 14, 2026. The March 31 deadline contract alone has generated $8.70M in volume.
Is the Polymarket Iran market reliable as a forecast?
The market's $506K liquidity relative to its $21M+ volume suggests prices can be moved by relatively small orders, which reduces reliability as a precise probability estimate. The directional signal — that traders collectively view a US-Iran military confrontation as a material possibility in 2026 — is more robust than the specific percentage at any given moment.
What would make the Polymarket Iran market move sharply?
Key catalysts include: any credible reporting of US military mobilization toward Iran, incidents in the Strait of Hormuz or involving US bases in the Middle East, breakdown in diplomatic channels, Congressional authorization discussions, or conversely, a de-escalatory diplomatic breakthrough. Given the thin liquidity, even modest-sized trades ($50K+) could move prices several percentage points.
